The Big Mac Index
You know how it goes…two all beef patties, special sauce, lettuce, cheese, on a sesame seed bun. That jingle hit the air waves in the mid 70’s and carried on for more than a decade, making it one of the best advertising campaigns for the food chain and making this burger the best seller for McDonald’s. Today, Big Macs are sold in more than 100 countries, spurring The Big Mac Index.
In essence, the index answers the question ‘how much is a Big Mac in Japan?’
Something that started out as a lighthearted guide to measure whether currencies were at their correct level has turned into a global industry standard. Introduced in 1986 in The Economist by Pam Woodall, this index is now published annually, referred to by statisticians and has been included in several economics textbooks. Giving rise to the word burgernomics, the index is sort of an easy way to gauge currency and spending power in other countries.
According to the magazine, “it is based on the theory of purchasing-power parity (PPP), the notion that in the long run exchange rates should move towards the rate that would equalize the prices of an identical basket of goods and services (in this case, a burger) in any two countries.”
For example, in Canada, on average, you can get a Big Mac for $5.64 ($5.52 US) compared to our neighbours to the south who can buy the same Big Mac for $4.80 in their own dollars. At the high end of the spectrum (again, in US dollars) in Norway you pay $7.76 and at the low end, in the Ukraine $1.63. Updated annually, the index gives real time comparisons and “this adjusted index addresses the criticism that you would expect average burger process to be cheaper in poor countries than in rich ones because labour costs are lower.”
The Big Mac Index – now available in an interactive currency-comparison tool.
This tool measures the exchange rate between two countries, according to The Economist, ‘by dividing the price of a Big Mac in one country (in its currency) by the price of a Big Mac in another country (in its currency). This value is then compared with the actual exchange rate; if it is lower, then the first currency is under-valued (according to the PPP theory) compared with the second, and conversely, if it is higher, then the first currency is over-valued.’
For example, scroll over the US and the Big Mac is $4.80, then scroll over Russia, and you will see the burger at $2.55 which suggests the currency there, the rouble, is undervalued by 46.7%.
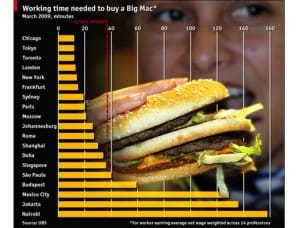
The Union Bank of Switzerland, UBS Wealth Management Research, has expanded the idea of the Big Mac index to include the amount of time an average worker in a given country must work to earn enough to purchase a Big Mac. This may give a more realistic view of the purchasing power of the average worker, as it takes into account more factors, such as local wages.

You Might Want to Read
November 8, 2023
Meet the Dougallers: Conor Hache
November 2, 2023
Welcome M.B. Kouri Insurance Brokers to the McDougall Insurance Team!
October 31, 2023
Why You Should Get Homeowners Builders Risk Insurance


