Natural and Man Made Disasters Cost $71 Billion
Think the tough weather is over, think again! In Southern Ontario, according to Environment and Climate Change Canada, the average lightening/tornado season runs from mid-March until the end of November. Also, hurricane season starts in June and extends right up until the end of November.
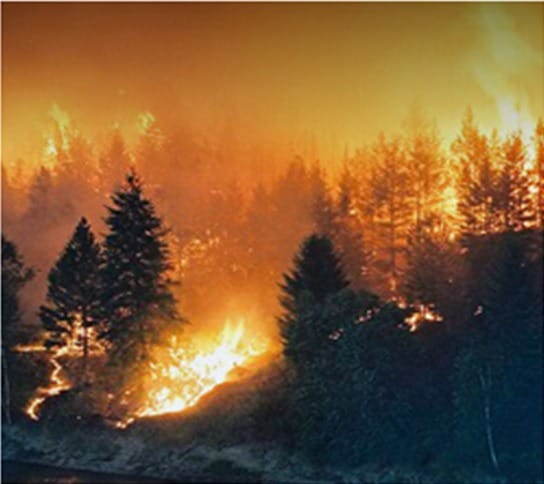
Much of Canada experienced a warmer than normal summer – and we have seen extreme heat and drought conditions in Ontario. The effects of that heat and drought were certainly felt by B.C. and Alberta, where the risks of forest fires were the highest; and unfortunately, Fort McMurray was at the center of it all.
Forest fires are no surprise to the western provinces, but the Fort McMurray fires were alarming causing the evacuation of the entire city before the blaze engulfed the area. This single fire may end up being the most costly disaster in Canadian history, according to the Calgary Sun.
The rain sure brings relief from the hot and dry weather, but it can be so severe that we are not out of the woods yet. The threat of damaging storms remains across Ontario and further East well beyond this fall. In a recent article published in the Top Broker, “a preliminary study from Swiss Re estimates the global insurance industry has covered 44 per cent, or US$31 billion, of total economic losses in the first half of 2016.”
The payouts are largely attributed to thunderstorms in the United States, but the wildfires of Fort McMurray accounted for US$2.5 billion of protected losses. The numbers are staggering, and with the ongoing hurricane season, those figures are sure to climb.
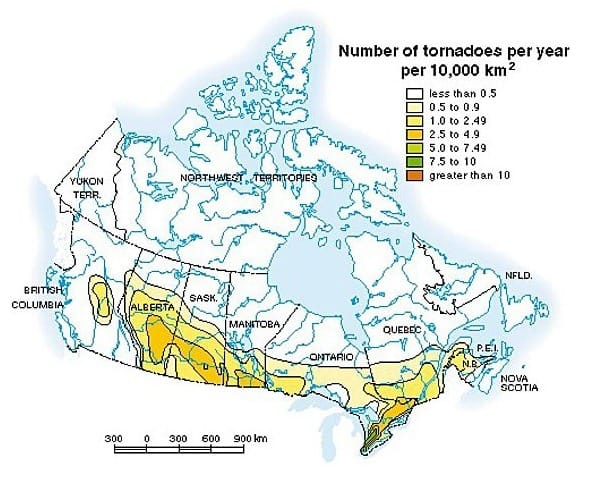
According to Accu Weather, Southwestern Ontario averages the highest number of tornadoes annually.

Fast Canadian Lightning Facts From Environment and Climate Change Canada
• The approximate number of cloud to ground lightning flashes detected in Canada since the Canadian Lightning Detection Network (CLDN) began in 1998 is 34.0 million.
• The average number of lightning flashes per year in Canada is 2.2638 million.
• The minimum number of lightning flashes in Canada in one year was 1.5709 million in 2009.
• The maximum number of lightning flashes in Canada in one year was 2.9631 million in 2005.
• The northern most lightning flash detected in Canada was detected at 74.004 degrees North and 102.6924 degrees West, over Viscount Melville Sound, Northwest of Prince of Wales Island. The lightning strike was recorded on August 11, 2003.
• The month that is likely to have the most number of lightning flashes in Canada is July.
• The most frequent time of day for lightning is between 1 p.m. and 6 p.m. local time.
• The greatest 10-year average number of days with lightning in Canada is an average of 32.3 a year, near Harrow, Ontario.
• The Canadian region with the greatest annual number of days with lightning in any one year is inland of the north shore of Lake Erie near Highgate, Ontario.
• The Canadian city with the greatest number of days with lightning in any one year is Windsor, Ontario, which had 47 days of lightning in 2006.
You Might Want to Read
November 8, 2023
Meet the Dougallers: Conor Hache
November 2, 2023
Welcome M.B. Kouri Insurance Brokers to the McDougall Insurance Team!
October 31, 2023
Why You Should Get Homeowners Builders Risk Insurance


